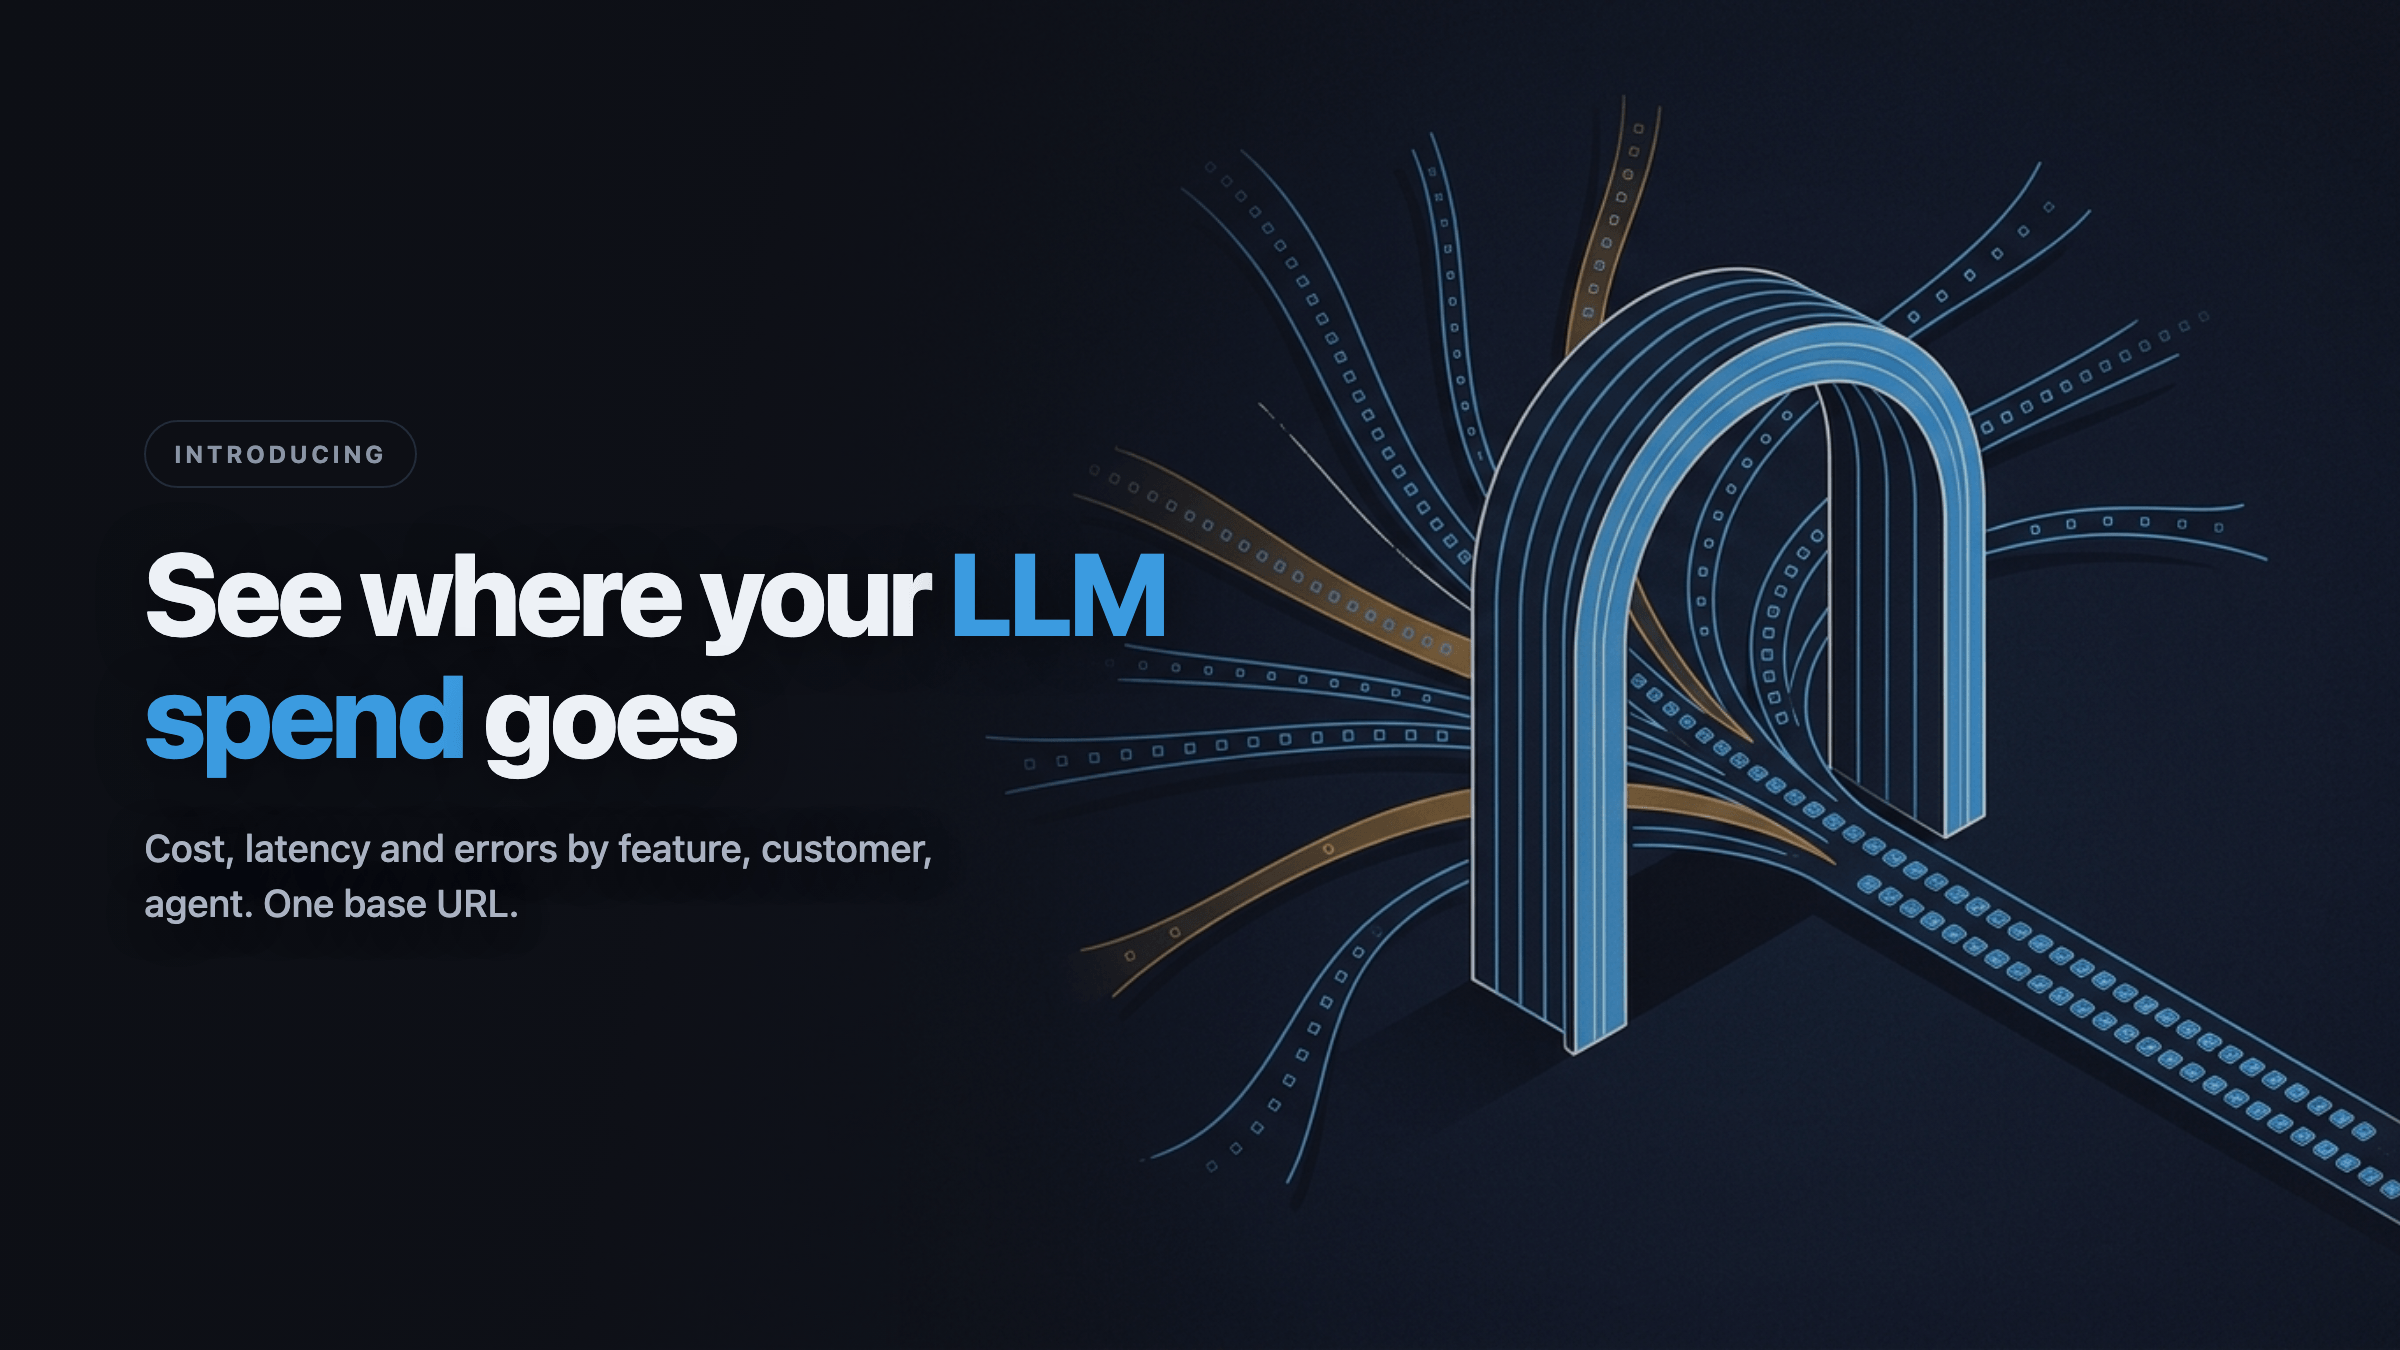
Hello, Toolken: Visibility Across Cost, Performance, and Reliability for LLM Teams

Every team building on LLMs runs into the same set of questions eventually.
The bill comes in and it is higher than last month. Which feature drove it? Which customer? Was it a prompt that grew silently after a refactor, or a new use case that nobody priced out?
Latency spikes. The p95 is fine in your APM, but certain calls are taking 8 seconds. Which model? Which feature path? Which customers are affected?
A provider starts returning errors. You notice in support tickets before you notice in your dashboards. You have no per-feature error rate, no breakdown by provider or model.
These are not edge cases. They are the default operating conditions for teams that build seriously on LLMs.
The attribution problem
The root issue is attribution. OpenAI, Anthropic, and every other provider bill you as a single account. You see aggregate spend, aggregate token counts, aggregate latency averages. Your application, however, has dozens of distinct call sites: a chat interface, a summarization pipeline, an embedding job, a document classifier. Each one has a different cost profile, a different latency target, and a different acceptable error rate.
Without a layer that routes every request through a structured context (which feature, which customer, which agent, which environment), every metric is an average of things that should not be averaged together.
What Toolken does today
Toolken is a cloud-hosted LLM gateway that sits between your code and your providers. The setup is a one-line change: point your existing SDK or HTTP client at the Toolken base URL and add your X-Toolken-Key header. No new SDK to learn, no client library to vendor.
From there, every request you send carries attribution metadata. Pass any key you want: feature, customer_id, agent_name, environment. Toolken records cost, token counts, latency, and status for every call and attributes it to those dimensions.
What you get out of the box, today:
Cost attribution. Token spend broken down by any metadata key you pass. Drill from total monthly spend down to cost per feature, per customer, per model, per environment.
Latency tracking. Time to first token and total latency recorded per request, queryable by the same dimensions. Slow models and slow features become visible.
Reliability metrics. Error rates and status codes tracked per provider, per model, per call site. Silent provider degradation shows up as a spike, not a support ticket.
Hosted dashboards. Usage KPIs, trends, and breakdowns available in the web UI without standing up your own data pipeline.
Team management. Multiple API keys, multiple environments, RBAC, team member access control.
BYOK (bring your own keys). Your provider credentials are forwarded directly to the provider. Toolken never pools or stores them. You keep full control of your provider relationships.
Today Toolken routes to around 13 providers, including native support for OpenAI and Anthropic, and OpenAI-compatible routing for the rest.
What is coming next
The observability foundation is live. The control layer is next.
Budgets and caps (Planned): set spend or token limits per API key, per team, or per any metadata dimension. A runaway loop hits a cap at the edge before the provider bill does.
Smart routing and fallback (Planned): automatic failover between providers, load balancing, and cost-based or latency-based routing across equivalent models.
Vault (Planned): enforced in-band key management and budget control, so no request leaves without authorization.
Response and semantic cache (Planned): cache identical or semantically equivalent completions to cut repeat spend.
PII anonymizer (Planned): strip sensitive content before it reaches the provider.
Agent tracing and full transcript logging (Planned): trace multi-step agent calls end-to-end, with optional full request/response capture.
The honest comparison
If you have researched this space, you have probably looked at LiteLLM Proxy. It is open-source, self-hosted, supports 100-plus providers, has routing and caching today, and uses the same base-URL pattern. It is a solid project.
The tradeoff is operational: you install, configure, and run it yourself. You manage the infrastructure, the upgrades, and the database behind its dashboard.
Toolken is managed cloud. You get the observability stack, the dashboards, and the attribution layer without standing up infrastructure. For teams that want to move fast and not operate another service, that is the difference.
Getting started
Toolken is in closed beta. If your team is building seriously on LLMs and wants real attribution across cost, latency, and errors, request access.
Five-minute setup. Free up to 10,000 requests per month.
Ready to see your LLM cost, latency, and errors by feature?
5-minute setup. Free up to 10,000 requests/month.
Join the Beta